Are Homes Overvalued in Greater Phoenix? | Only 6 Cities Left in Seller's Markets
It's been a crazy real estate month - markets are relatively balanced, with advantages for buyers despite higher interest rates. The question remains, is the market truly overvalued and if so, what might bring home prices down - or make them spur ahead? Hear what our smart economists at the Cromford Report have to say about each segment, and let's have a solid plan in place whether your goal is to buy or sell; let's get the most value for you no matter what your goal.
For Buyers
In April, there was a crisis of “crisis” headlines, spurred by unexpected tariffs and market volatility. The end result was mortgage rates rising from 6.6% to 7.1%, which frankly is nothing new for the housing industry. In fact, mortgage rates were higher at 7.2% just last January and even higher last May at 7.3% without any headlines screaming “crisis". Unfortunately, this time active buyers froze with indecisiveness and shock, resulting in an 18% drop in weekly accepted contracts for 3 weeks after the tariff announcement. Fortunately, the first few weeks of May saw a small recovery as some buyers woke up and got back to business.
From the mess of chaos erupted a wave of opportunistic negative predictions about the housing market across social media platforms. Even Newsweek ran an article suggesting that homes in Greater Phoenix could drop by 20%. While buyers would certainly swarm the housing market if property values suddenly dropped by 20%, the chance of that happening is slim. While Greater Phoenix is slipping farther into a buyer’s market, it’s not extreme enough for a collapse of that magnitude. Buyer’s markets over the past 25 years, excluding the 2008 sub-prime mortgage collapse, saw prices drop between 5% and 11% year-over-year, and those price declines were enough to pull the market back into a seller’s market each time.
Questions persist about the degree to which Greater Phoenix homes are overvalued. To answer this, a basis must be established prior to the 2005-2008 bubble/crash and a “typical home” defined. The median home sold in Maricopa County was 1,600sqft in 2000 and 1,900sqft in 2025, so a single family home of 1,500-2,000sqft is typical for this region. The annual appreciation rates from Q1 2001 thru Q1 2004 ranged from 3.6% to 5.3% with a median of 4.65%. The median rate across 25 years from Q1 2000 to Q1 2025 is 5.3% (high of 32.9% and low of –41.4%). Extrapolating the 4.65% appreciation rate over 25 years supports a price correction of 3% by next year. However, one could argue that prices are currently in line with where they would’ve been with a 5% annual appreciation rate over 25 years, below the 5.3% long term median and are already undervalued. Either way, the current buyer’s market supports declining prices over the next 3 months; 20% is extreme, but 3% is more reasonable. If mortgage rates move closer to 6.5% or lower, all projections will change again.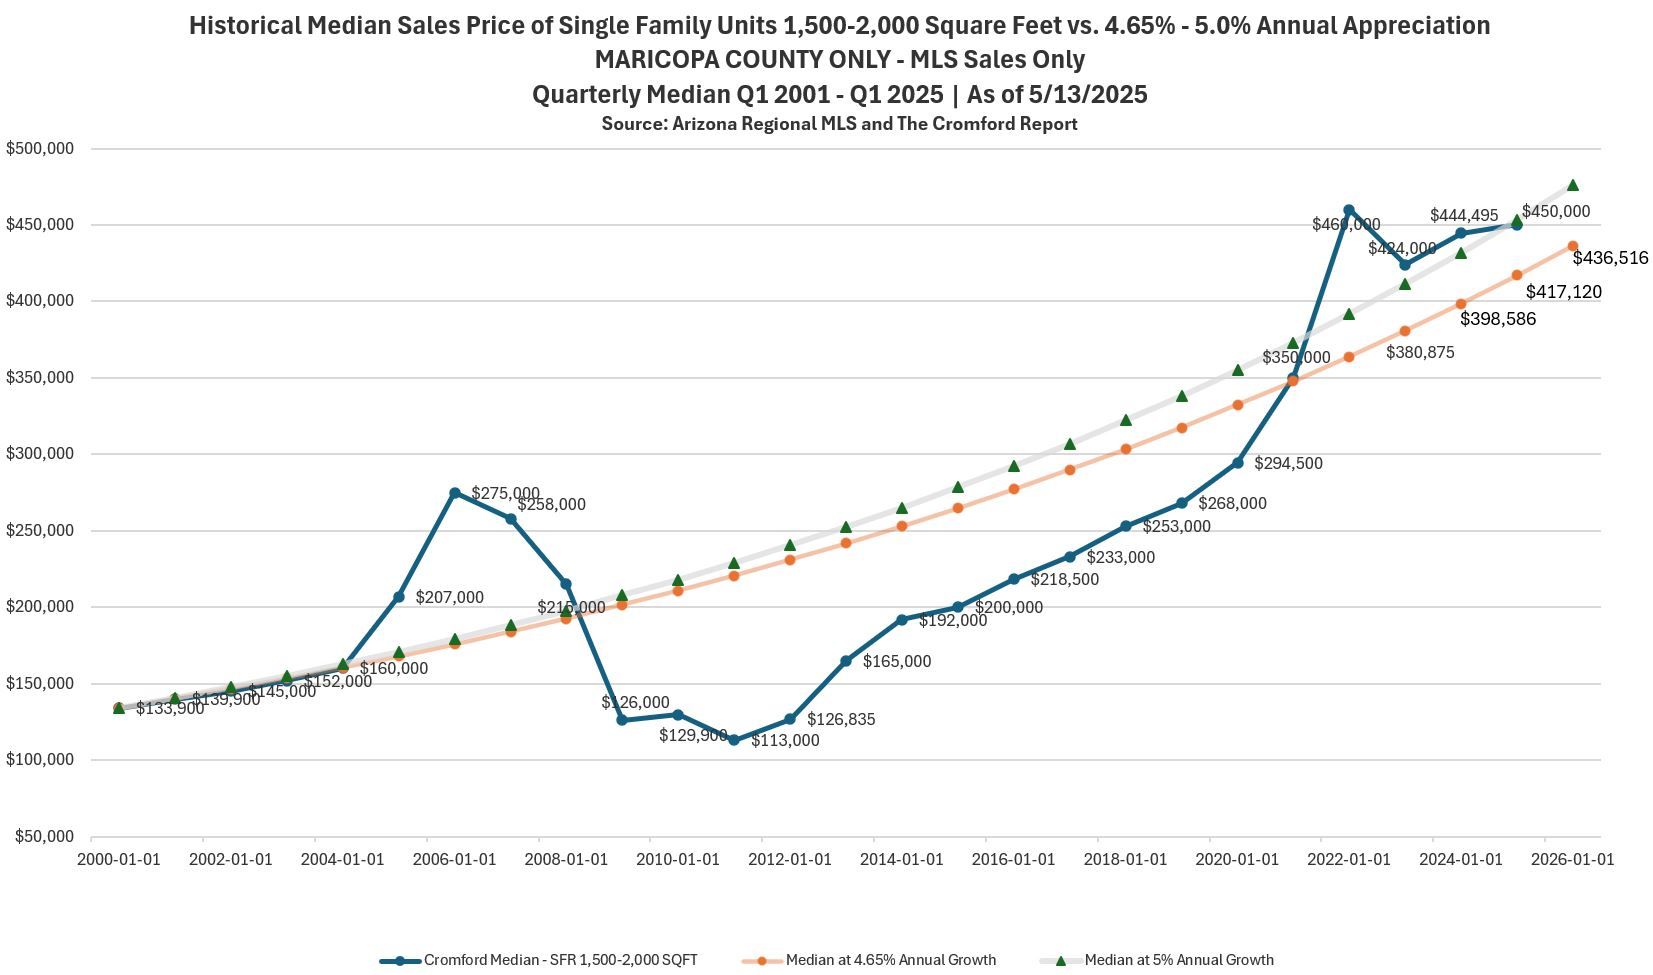
For Sellers
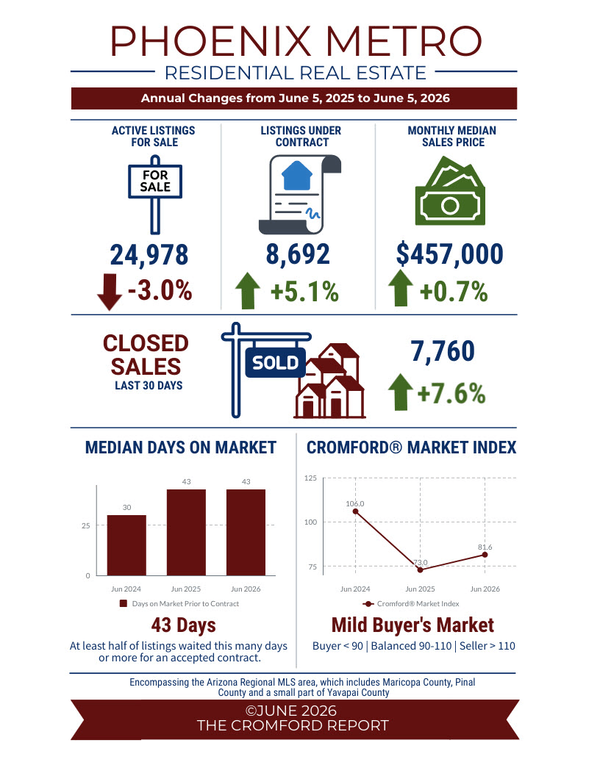
Brace yourselves, some buyers have become drunk with power. Negotiations have evolved from repairs and closing costs to remodeling requests in some cases; asking to replace things that are functioning properly, but are simply not new or upgraded. Only 6 cities are left in seller’s markets, and they’re not very strong. They are El Mirage, Apache Junction, Tolleson, Chandler, Avondale, and Fountain Hills. Interior cities Glendale, Phoenix, Paradise Valley, Scottsdale, and Gilbert all dropped from seller’s markets to balanced markets over the past 30 days, joining Mesa, Tempe, Cave Creek, Anthem, and Laveen. The remaining 13 cities are still in buyer’s markets.
After having the best year ever for sales over $1M, volatility in the stock market in March and April caused lower luxury sales in April. At the same time, lower mortgage rates in March led to a higher number of closings under $500K in April. Thus sales under $500K went from 56.7% market share in March to 60.1% in April, pulling down both the average and median price measures, and showing a 3.5% drop month-over-month and 1.1% drop year-over-year. Both months averaged 315 closings per day. April saw a drop in contract activity, so May will be weaker for sales but hope remains for June.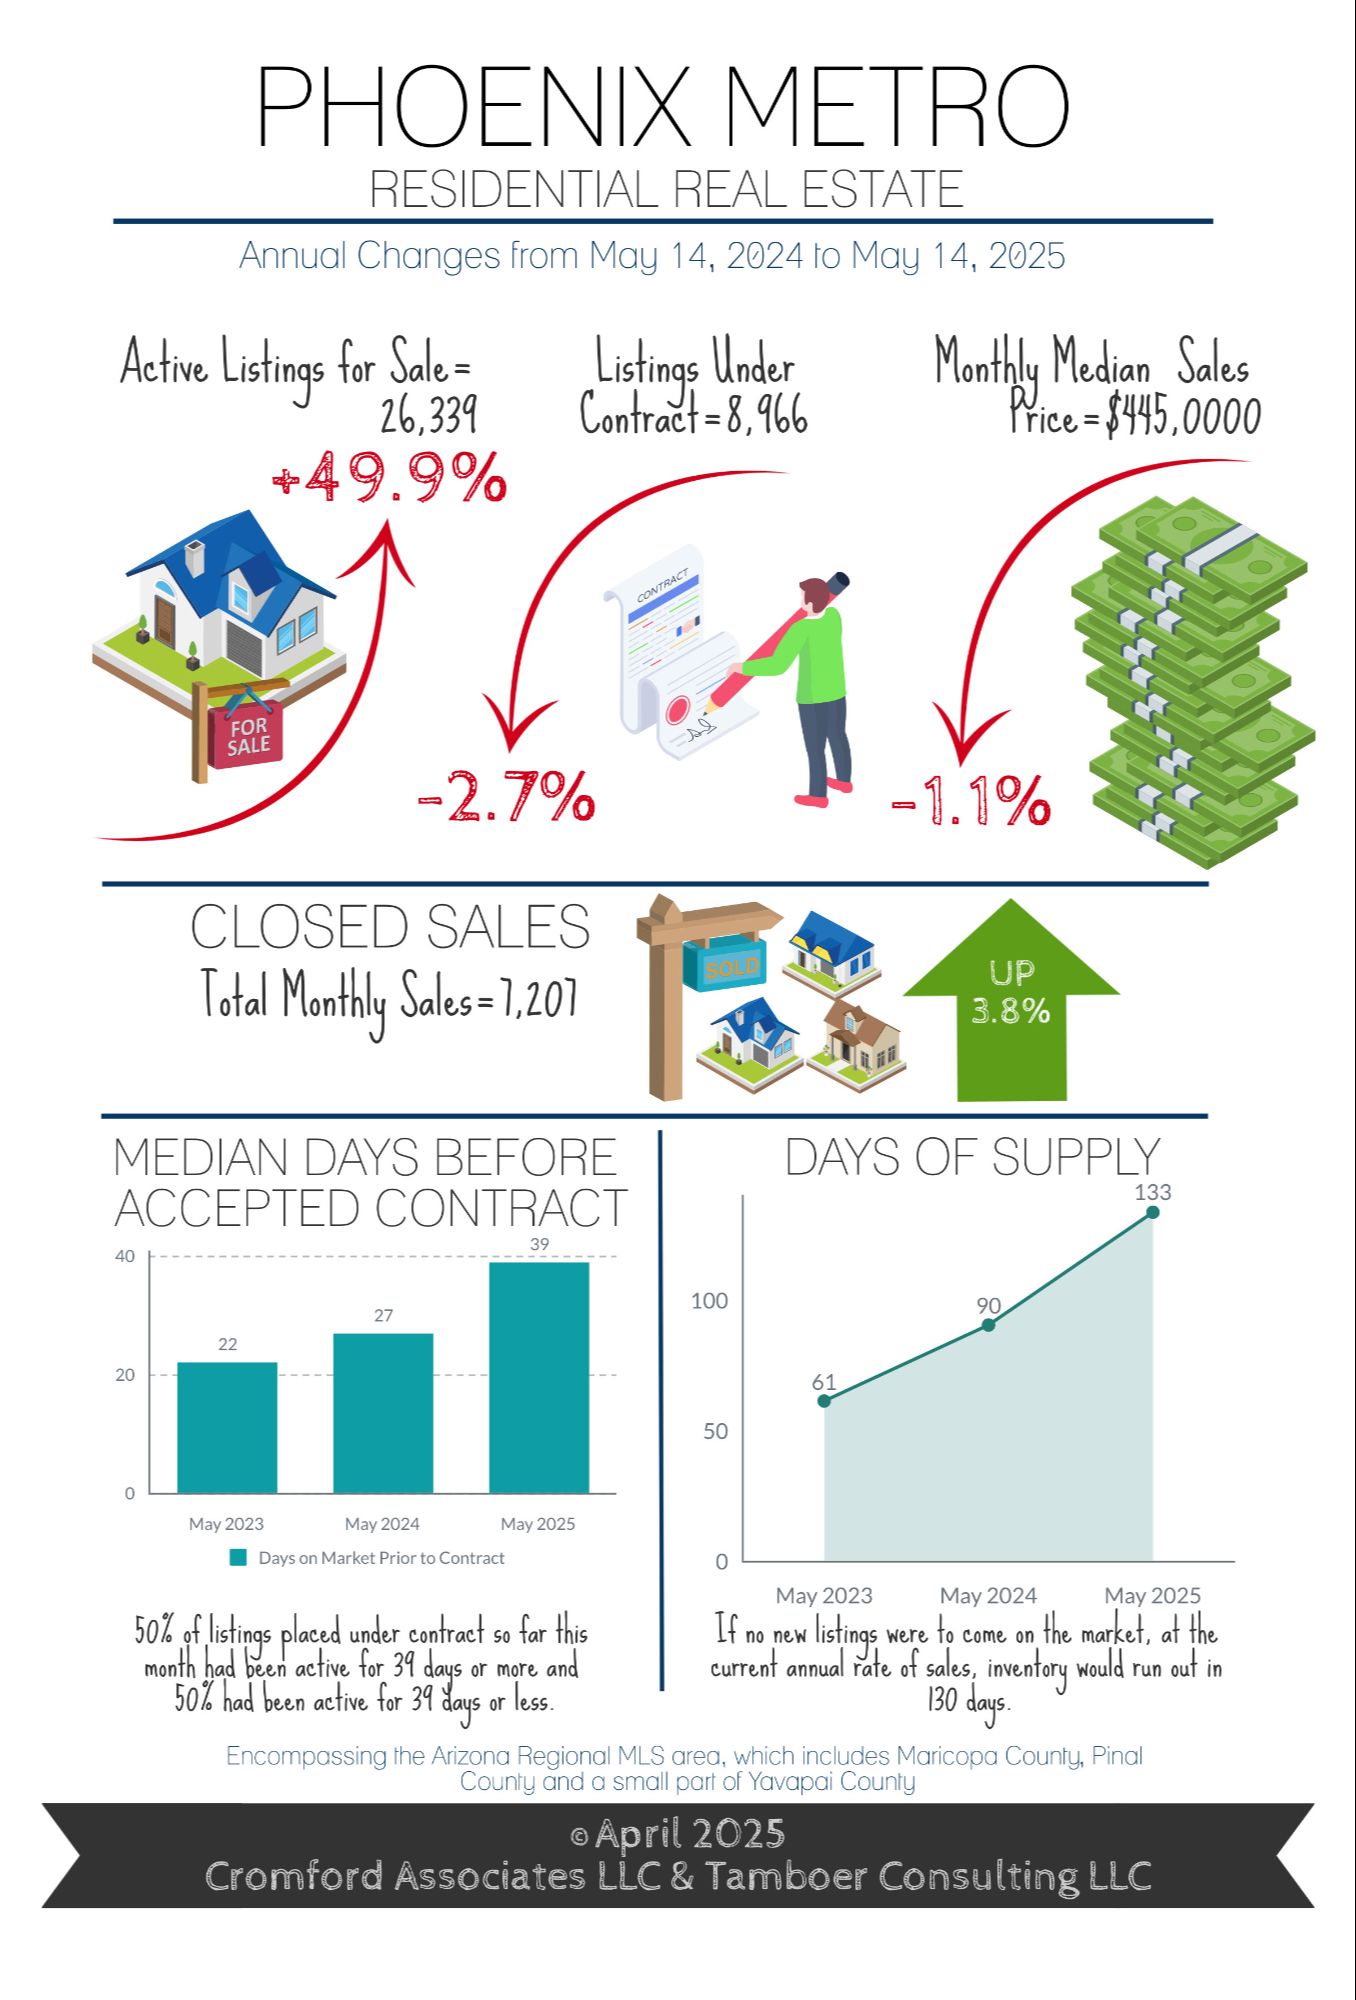
Commentary written by Tina Tamboer, Senior Housing Analyst with The Cromford Report ©2025 Cromford Associates LLC and Tamboer Consulting LLC
Have questions about buying or selling a home in today's market - reach out to me and let's chat! Reach me at https://linktr.ee/brianeastwoodrealtor. It can be overwhelming, but I’m here to help you.
Recent Posts